

- 1 Welcome to PRTG
- 2 Quick Start Guide
- 3 Using PRTG Hosted Monitor
- 4 Installing the Software
- 5 Understanding Basic Concepts
- 6 Basic Procedures
- 6.1 Login
- 6.2 Welcome Page
- 6.3 General Layout
- 6.4 Sensor States
- 6.5 Historic Data Reports
- 6.6 Similar Sensors
- 6.7 Recommended Sensors
- 6.8 Object Settings
- 6.9 Alarms
- 6.10 System Information
- 6.11 Logs
- 6.12 Tickets
- 6.13 Working with Table Lists
- 6.14 Object Selector
- 6.15 Priority and Favorites
- 6.16 Pause
- 6.17 Context Menus
- 6.18 Hover Popup
- 6.19 Main Menu Structure
- 7 Device and Sensor Setup
- 7.1 Auto-Discovery
- 7.2 Create Objects Manually
- 7.3 Manage Device Tree
- 7.4 Root Group Settings
- 7.5 Probe Settings
- 7.6 Group Settings
- 7.7 Device Settings
- 7.8 Sensor Settings
- 7.8.1 Active Directory Replication Errors Sensor
- 7.8.2 ADO SQL v2 Sensor
- 7.8.3 Application Server Health (Autonomous) Sensor
- 7.8.4 AWS Alarm v2 Sensor
- 7.8.5 AWS Cost Sensor
- 7.8.6 AWS EBS v2 Sensor
- 7.8.7 AWS EC2 v2 Sensor
- 7.8.8 AWS ELB v2 Sensor
- 7.8.9 AWS RDS v2 Sensor
- 7.8.10 Beckhoff IPC System Health Sensor
- 7.8.11 Business Process Sensor
- 7.8.12 Cisco IP SLA Sensor
- 7.8.13 Cisco Meraki License Sensor
- 7.8.14 Cisco Meraki Network Health Sensor
- 7.8.15 Cisco WLC Access Point Overview Sensor
- 7.8.16 Citrix XenServer Host Sensor
- 7.8.17 Citrix XenServer Virtual Machine Sensor
- 7.8.18 Cloud HTTP v2 Sensor
- 7.8.19 Cloud Ping v2 Sensor
- 7.8.20 Cluster Health Sensor
- 7.8.21 Core Health Sensor
- 7.8.22 Core Health (Autonomous) Sensor
- 7.8.23 Dell EMC Unity Enclosure Health v2 Sensor
- 7.8.24 Dell EMC Unity File System v2 Sensor
- 7.8.25 Dell EMC Unity Storage Capacity v2 Sensor
- 7.8.26 Dell EMC Unity Storage LUN v2 Sensor
- 7.8.27 Dell EMC Unity Storage Pool v2 Sensor
- 7.8.28 Dell EMC Unity VMware Datastore v2 Sensor
- 7.8.29 Dell PowerVault MDi Logical Disk Sensor
- 7.8.30 Dell PowerVault MDi Physical Disk Sensor
- 7.8.31 DHCP Sensor
- 7.8.32 DICOM Bandwidth Sensor
- 7.8.33 DICOM C-ECHO Sensor
- 7.8.34 DICOM Query/Retrieve Sensor
- 7.8.35 DNS v2 Sensor
- 7.8.36 Docker Container Status Sensor
- 7.8.37 Enterprise Virtual Array Sensor
- 7.8.38 Event Log (Windows API) Sensor
- 7.8.39 Exchange Backup (PowerShell) Sensor
- 7.8.40 Exchange Database (PowerShell) Sensor
- 7.8.41 Exchange Database DAG (PowerShell) Sensor
- 7.8.42 Exchange Mail Queue (PowerShell) Sensor
- 7.8.43 Exchange Mailbox (PowerShell) Sensor
- 7.8.44 Exchange Public Folder (PowerShell) Sensor
- 7.8.45 EXE/Script Sensor
- 7.8.46 EXE/Script Advanced Sensor
- 7.8.47 File Sensor
- 7.8.48 File Content Sensor
- 7.8.49 Folder Sensor
- 7.8.50 FortiGate System Statistics Sensor
- 7.8.51 FortiGate VPN Overview Sensor
- 7.8.52 FTP Sensor
- 7.8.53 FTP Server File Count Sensor
- 7.8.54 HL7 Sensor
- 7.8.55 HPE 3PAR Common Provisioning Group Sensor
- 7.8.56 HPE 3PAR Drive Enclosure Sensor
- 7.8.57 HPE 3PAR Virtual Volume Sensor
- 7.8.58 HTTP Sensor
- 7.8.59 HTTP v2 Sensor
- 7.8.60 HTTP Advanced Sensor
- 7.8.61 HTTP Apache ModStatus PerfStats Sensor
- 7.8.62 HTTP Apache ModStatus Totals Sensor
- 7.8.63 HTTP Content Sensor
- 7.8.64 HTTP Data Advanced Sensor
- 7.8.65 HTTP Full Web Page Sensor
- 7.8.66 HTTP IoT Push Data Advanced Sensor
- 7.8.67 HTTP Push Count Sensor
- 7.8.68 HTTP Push Data Sensor
- 7.8.69 HTTP Push Data Advanced Sensor
- 7.8.70 HTTP Transaction Sensor
- 7.8.71 HTTP Webpage Sensor
- 7.8.72 HTTP XML/REST Value Sensor
- 7.8.73 Hyper-V Cluster Shared Volume Disk Free Sensor
- 7.8.74 Hyper-V Host Server Sensor
- 7.8.75 Hyper-V Virtual Machine Sensor
- 7.8.76 Hyper-V Virtual Network Adapter Sensor
- 7.8.77 Hyper-V Virtual Storage Device Sensor
- 7.8.78 IMAP Sensor
- 7.8.79 IP on DNS Blacklist Sensor
- 7.8.80 IP Reputation Score Sensor
- 7.8.81 IPFIX Sensor
- 7.8.82 IPFIX (Custom) Sensor
- 7.8.83 IPMI System Health Sensor
- 7.8.84 jFlow v5 Sensor
- 7.8.85 jFlow v5 (Custom) Sensor
- 7.8.86 LDAP Sensor
- 7.8.87 Local Folder Sensor
- 7.8.88 Microsoft 365 Mailbox Sensor
- 7.8.89 Microsoft 365 Service Status Sensor
- 7.8.90 Microsoft 365 Service Status Advanced Sensor
- 7.8.91 Microsoft Azure SQL Database Sensor
- 7.8.92 Microsoft Azure Storage Account Sensor
- 7.8.93 Microsoft Azure Subscription Cost Sensor
- 7.8.94 Microsoft Azure Virtual Machine Sensor
- 7.8.95 Microsoft SQL v2 Sensor
- 7.8.96 Modbus RTU Custom Sensor
- 7.8.97 Modbus TCP Custom Sensor
- 7.8.98 MQTT Round Trip Sensor
- 7.8.99 MQTT Statistics Sensor
- 7.8.100 MQTT Subscribe Custom Sensor
- 7.8.101 Multi-Platform Probe Connection Health (Autonomous) Sensor
- 7.8.102 Multi-Platform Probe Health Sensor
- 7.8.103 MySQL v2 Sensor
- 7.8.104 NATS Server Overview Sensor
- 7.8.105 NetApp Aggregate Sensor
- 7.8.106 NetApp Aggregate v2 Sensor
- 7.8.107 NetApp I/O Sensor
- 7.8.108 NetApp I/O v2 Sensor
- 7.8.109 NetApp LIF Sensor
- 7.8.110 NetApp LIF v2 Sensor
- 7.8.111 NetApp LUN Sensor
- 7.8.112 NetApp LUN v2 Sensor
- 7.8.113 NetApp NIC Sensor
- 7.8.114 NetApp NIC v2 Sensor
- 7.8.115 NetApp Physical Disk Sensor
- 7.8.116 NetApp Physical Disk v2 Sensor
- 7.8.117 NetApp SnapMirror Sensor
- 7.8.118 NetApp SnapMirror v2 Sensor
- 7.8.119 NetApp System Health Sensor
- 7.8.120 NetApp System Health v2 Sensor
- 7.8.121 NetApp Volume Sensor
- 7.8.122 NetApp Volume v2 Sensor
- 7.8.123 NetFlow v5 Sensor
- 7.8.124 NetFlow v5 (Custom) Sensor
- 7.8.125 NetFlow v9 Sensor
- 7.8.126 NetFlow v9 (Custom) Sensor
- 7.8.127 Network Share Sensor
- 7.8.128 OPC UA Certificate Sensor
- 7.8.129 OPC UA Custom Sensor
- 7.8.130 OPC UA Server Status Sensor
- 7.8.131 Oracle SQL v2 Sensor
- 7.8.132 Oracle Tablespace Sensor
- 7.8.133 Packet Sniffer Sensor
- 7.8.134 Packet Sniffer (Custom) Sensor
- 7.8.135 PerfCounter Custom Sensor
- 7.8.136 PerfCounter IIS Application Pool Sensor
- 7.8.137 Ping Sensor
- 7.8.138 Ping v2 Sensor
- 7.8.139 Ping Jitter Sensor
- 7.8.140 Ping Jitter v2 Sensor
- 7.8.141 POP3 Sensor
- 7.8.142 Port Sensor
- 7.8.143 Port v2 Sensor
- 7.8.144 Port Range Sensor
- 7.8.145 PostgreSQL Sensor
- 7.8.146 Probe Health Sensor
- 7.8.147 Proxmox VE Cluster Health Sensor
- 7.8.148 Proxmox VE Container Status Sensor
- 7.8.149 Proxmox VE Virtual Machine Status Sensor
- 7.8.150 Proxmox VE Node Performance Sensor
- 7.8.151 PRTG Data Hub Process Sensor
- 7.8.152 PRTG Data Hub Rule Sensor
- 7.8.153 PRTG Data Hub Traffic Sensor
- 7.8.154 QoS (Quality of Service) One Way Sensor
- 7.8.155 QoS (Quality of Service) Round Trip Sensor
- 7.8.156 RADIUS v2 Sensor
- 7.8.157 RDP (Remote Desktop) Sensor
- 7.8.158 RDP Client-Side Check Sensor
- 7.8.159 Redfish Power Supply Sensor
- 7.8.160 Redfish System Health Sensor
- 7.8.161 Redfish Virtual Disk Sensor
- 7.8.162 REST Custom Sensor
- 7.8.163 REST Custom v2 Sensor
- 7.8.164 REST JSON Data Sensor
- 7.8.165 Script v2 Sensor
- 7.8.166 Sensor Factory Sensor
- 7.8.167 sFlow Sensor
- 7.8.168 sFlow (Custom) Sensor
- 7.8.169 Share Disk Free Sensor
- 7.8.170 SIMATIC S7-1200/1500 CPU Status Sensor
- 7.8.171 SIMATIC S7-300/400 CPU Restart Overview Sensor (BETA)
- 7.8.172 SIMATIC S7-300/400 CPU Status Sensor (BETA)
- 7.8.173 SIMATIC S7-300/400 LED Status (BETA)
- 7.8.174 SIP Options Ping Sensor
- 7.8.175 SMTP Sensor
- 7.8.176 SMTP&IMAP Round Trip Sensor
- 7.8.177 SMTP&POP3 Round Trip Sensor
- 7.8.178 SNMP APC Hardware Sensor
- 7.8.179 SNMP Buffalo TS System Health Sensor
- 7.8.180 SNMP Cisco ADSL Sensor
- 7.8.181 SNMP Cisco ASA VPN Connections Sensor
- 7.8.182 SNMP Cisco ASA VPN Traffic Sensor
- 7.8.183 SNMP Cisco ASA VPN Users Sensor
- 7.8.184 SNMP Cisco CBQoS Sensor
- 7.8.185 SNMP Cisco System Health Sensor
- 7.8.186 SNMP Cisco UCS Blade Sensor
- 7.8.187 SNMP Cisco UCS Chassis Sensor
- 7.8.188 SNMP Cisco UCS Physical Disk Sensor
- 7.8.189 SNMP Cisco UCS System Health Sensor
- 7.8.190 SNMP CPU Load Sensor
- 7.8.191 SNMP CPU Usage Sensor
- 7.8.192 SNMP Custom Sensor
- 7.8.193 SNMP Custom Advanced Sensor
- 7.8.194 SNMP Custom String Sensor
- 7.8.195 SNMP Custom String v2 Sensor
- 7.8.196 SNMP Custom String Lookup Sensor
- 7.8.197 SNMP Custom Table Sensor
- 7.8.198 SNMP Custom v2 Sensor
- 7.8.199 SNMP Dell EqualLogic Logical Disk Sensor
- 7.8.200 SNMP Dell EqualLogic Member Health Sensor
- 7.8.201 SNMP Dell EqualLogic Physical Disk Sensor
- 7.8.202 SNMP Dell Hardware Sensor
- 7.8.203 SNMP Dell PowerEdge Physical Disk Sensor
- 7.8.204 SNMP Dell PowerEdge System Health Sensor
- 7.8.205 SNMP Disk Free Sensor
- 7.8.206 SNMP Disk Free v2 Sensor
- 7.8.207 SNMP Fujitsu System Health v2 Sensor
- 7.8.208 SNMP Hardware Status Sensor
- 7.8.209 SNMP HP LaserJet Hardware Sensor
- 7.8.210 SNMP HPE BladeSystem Blade Sensor
- 7.8.211 SNMP HPE BladeSystem Enclosure Health Sensor
- 7.8.212 SNMP HPE ProLiant Logical Disk Sensor
- 7.8.213 SNMP HPE ProLiant Memory Controller Sensor
- 7.8.214 SNMP HPE ProLiant Network Interface Sensor
- 7.8.215 SNMP HPE ProLiant Physical Disk Sensor
- 7.8.216 SNMP HPE ProLiant System Health Sensor
- 7.8.217 SNMP IBM System X Logical Disk Sensor
- 7.8.218 SNMP IBM System X Physical Disk Sensor
- 7.8.219 SNMP IBM System X Physical Memory Sensor
- 7.8.220 SNMP IBM System X System Health Sensor
- 7.8.221 SNMP interSeptor Pro Environment Sensor
- 7.8.222 SNMP Juniper NS System Health Sensor
- 7.8.223 SNMP LenovoEMC Physical Disk Sensor
- 7.8.224 SNMP LenovoEMC System Health Sensor
- 7.8.225 SNMP Library Sensor
- 7.8.226 SNMP Linux Block Device I/O Sensor
- 7.8.227 SNMP Linux Disk Free Sensor
- 7.8.228 SNMP Linux Disk Free v2 Sensor
- 7.8.229 SNMP Linux Load Average Sensor
- 7.8.230 SNMP Linux Load Average v2 Sensor
- 7.8.231 SNMP Linux Meminfo Sensor
- 7.8.232 SNMP Linux Meminfo v2 Sensor
- 7.8.233 SNMP Linux Physical Disk Sensor
- 7.8.234 SNMP Memory Sensor
- 7.8.235 SNMP Memory v2 Sensor
- 7.8.236 SNMP NetApp Disk Free Sensor
- 7.8.237 SNMP NetApp Enclosure Sensor
- 7.8.238 SNMP NetApp I/O Sensor
- 7.8.239 SNMP NetApp License Sensor
- 7.8.240 SNMP NetApp Logical Unit Sensor
- 7.8.241 SNMP NetApp Network Interface Sensor
- 7.8.242 SNMP NetApp System Health Sensor
- 7.8.243 SNMP Nutanix Cluster Health Sensor
- 7.8.244 SNMP Nutanix Hypervisor Sensor
- 7.8.245 SNMP Poseidon Environment Sensor
- 7.8.246 SNMP Printer Sensor
- 7.8.247 SNMP Printer v2 Sensor
- 7.8.248 SNMP QNAP Logical Disk Sensor
- 7.8.249 SNMP QNAP Physical Disk Sensor
- 7.8.250 SNMP QNAP System Health Sensor
- 7.8.251 SNMP Rittal CMC III Hardware Status Sensor
- 7.8.252 SNMP RMON Sensor
- 7.8.253 SNMP RMON v2 Sensor
- 7.8.254 SNMP SonicWall System Health Sensor
- 7.8.255 SNMP SonicWall VPN Traffic Sensor
- 7.8.256 SNMP Synology Logical Disk Sensor
- 7.8.257 SNMP Synology Physical Disk Sensor
- 7.8.258 SNMP Synology System Health Sensor
- 7.8.259 SNMP System Uptime Sensor
- 7.8.260 SNMP Traffic Sensor
- 7.8.261 SNMP Traffic v2 Sensor
- 7.8.262 SNMP Trap Receiver Sensor
- 7.8.263 SNMP UPS Status Sensor
- 7.8.264 SNMP Uptime v2 Sensor
- 7.8.265 SNMP Windows Service v2 Sensor
- 7.8.266 SNMP Windows Service Sensor
- 7.8.267 SNTP Sensor
- 7.8.268 Soffico Orchestra Channel Health Sensor
- 7.8.269 Soffico Orchestra Scenario Sensor
- 7.8.270 SSH Disk Free Sensor
- 7.8.271 SSH Disk Free v2 Sensor
- 7.8.272 SSH INodes Free v2 Sensor
- 7.8.273 SSH Load Average v2 Sensor
- 7.8.274 SSH Meminfo v2 Sensor
- 7.8.275 SSH Remote Ping v2 Sensor
- 7.8.276 SSH SAN Enclosure Sensor
- 7.8.277 SSH SAN Logical Disk Sensor
- 7.8.278 SSH SAN Physical Disk Sensor
- 7.8.279 SSH SAN System Health Sensor
- 7.8.280 SSH Script Sensor
- 7.8.281 SSH Script v2 Sensor
- 7.8.282 SSH Script Advanced Sensor
- 7.8.283 SSL Certificate Sensor
- 7.8.284 SSL Security Check Sensor
- 7.8.285 SSL/TLS Certificate Sensor
- 7.8.286 SSL/TLS Security Check Sensor
- 7.8.287 Syslog Receiver Sensor
- 7.8.288 System Health Sensor
- 7.8.289 System Health v2 Sensor
- 7.8.290 TFTP Sensor
- 7.8.291 Traceroute Hop Count Sensor
- 7.8.292 Traceroute Hop Count v2 Sensor
- 7.8.293 Veeam Backup Job Status Sensor
- 7.8.294 Veeam Backup Job Status Advanced Sensor
- 7.8.295 VMware Datastore (REST) Sensor
- 7.8.296 VMware Datastore (SOAP) Sensor
- 7.8.297 VMware Host Hardware (WBEM) Sensor
- 7.8.298 VMware Host Hardware Status (SOAP) Sensor
- 7.8.299 VMware Host Performance (SOAP) Sensor
- 7.8.300 VMware Virtual Machine (SOAP) Sensor
- 7.8.301 Windows CPU Load Sensor
- 7.8.302 Windows IIS Application Sensor
- 7.8.303 Windows MSMQ Queue Length Sensor
- 7.8.304 Windows Network Card Sensor
- 7.8.305 Windows Pagefile Sensor
- 7.8.306 Windows Physical Disk I/O Sensor
- 7.8.307 Windows Print Queue Sensor
- 7.8.308 Windows Process Sensor
- 7.8.309 Windows SMTP Service Received Sensor
- 7.8.310 Windows SMTP Service Sent Sensor
- 7.8.311 Windows System Uptime Sensor
- 7.8.312 Windows Updates Status (PowerShell) Sensor
- 7.8.313 WMI Battery Sensor
- 7.8.314 WMI Custom Sensor
- 7.8.315 WMI Custom String Sensor
- 7.8.316 WMI Disk Health Sensor
- 7.8.317 WMI Event Log Sensor
- 7.8.318 WMI Exchange Server Sensor
- 7.8.319 WMI Exchange Transport Queue Sensor
- 7.8.320 WMI File Sensor
- 7.8.321 WMI Free Disk Space (Multi Disk) Sensor
- 7.8.322 WMI HDD Health Sensor
- 7.8.323 WMI Logical Disk I/O Sensor
- 7.8.324 WMI Memory Sensor
- 7.8.325 WMI Microsoft SQL Server Sensor
- 7.8.326 WMI Microsoft SQL Server 2005 Sensor (Deprecated)
- 7.8.327 WMI Microsoft SQL Server 2008 Sensor
- 7.8.328 WMI Microsoft SQL Server 2012 Sensor
- 7.8.329 WMI Microsoft SQL Server 2014 Sensor
- 7.8.330 WMI Microsoft SQL Server 2016 Sensor
- 7.8.331 WMI Microsoft SQL Server 2017 Sensor
- 7.8.332 WMI Microsoft SQL Server 2019 Sensor
- 7.8.333 WMI Microsoft SQL Server 2022 Sensor
- 7.8.334 WMI Remote Ping Sensor
- 7.8.335 WMI Security Center Sensor
- 7.8.336 WMI Service Sensor
- 7.8.337 WMI Service v2 Sensor (BETA)
- 7.8.338 WMI Share Sensor
- 7.8.339 WMI SharePoint Process Sensor
- 7.8.340 WMI Storage Pool Sensor
- 7.8.341 WMI Terminal Services (Windows 2008+) Sensor
- 7.8.342 WMI Terminal Services (Windows XP/Vista/2003) Sensor
- 7.8.343 WMI UTC Time Sensor
- 7.8.344 WMI Vital System Data v2 Sensor
- 7.8.345 WMI Volume Sensor
- 7.8.346 WMI Volume v2 Sensor
- 7.8.347 WSUS Statistics Sensor
- 7.8.348 Zoom Service Status Sensor
- 7.9 Additional Sensor Types (Custom Sensors)
- 7.10 Channel Settings
- 7.11 Notification Triggers Settings
- 8 Advanced Procedures
- 8.1 Toplists
- 8.2 Move Objects
- 8.3 Clone Object
- 8.4 Multi-Edit
- 8.5 Create Device Template
- 8.6 Show Dependencies
- 8.7 Geo Maps
- 8.8 Notifications
- 8.9 Libraries
- 8.10 Reports
- 8.11 Maps
- 8.12 Setup
- 9 PRTG MultiBoard
- 10 PRTG Apps for Mobile Network Monitoring
- 11 Desktop Notifications
- 12 Sensor Technologies
- 12.1 Monitoring via SNMP
- 12.2 Monitoring via WMI
- 12.3 Monitoring via SSH
- 12.4 Monitoring Bandwidth via Packet Sniffing
- 12.5 Monitoring Bandwidth via Flows
- 12.6 Bandwidth Monitoring Comparison
- 12.7 Monitoring Quality of Service
- 12.8 Monitoring Backups
- 12.9 Monitoring Virtual Environments
- 12.10 Monitoring Databases
- 12.11 Monitoring via HTTP
- 13 PRTG Administration Tool
- 14 Advanced Topics
- 14.1 Active Directory Integration
- 14.2 Application Programming Interface (API) Definition
- 14.3 Filter Rules for Flow, IPFIX, and Packet Sniffer Sensors
- 14.4 Channel Definitions for Flow, IPFIX, and Packet Sniffer Sensors
- 14.5 Define IP Address Ranges
- 14.6 Define Lookups
- 14.7 Regular Expressions
- 14.8 Calculating Percentiles
- 14.9 Add Remote Probe
- 14.10 Failover Cluster Configuration
- 14.11 Data Storage
- 15 Appendix
- 15.1 Abbreviations
- 15.2 Available Sensor Types
- 15.3 Default Ports
- 15.4 Differences between PRTG Network Monitor and PRTG Hosted Monitor
- 15.5 Escape Special Characters and Whitespaces in Parameters
- 15.6 Glossary
- 15.7 Icons
- 15.8 Legal Notices
- 15.9 Placeholders for Notifications
- 15.10 Standard Lookup Files
- 15.11 Supported AWS Regions and Their Codes
User Manual - Contents
 This sensor can generate a considerable amount of internet traffic if you use it with a short scanning interval.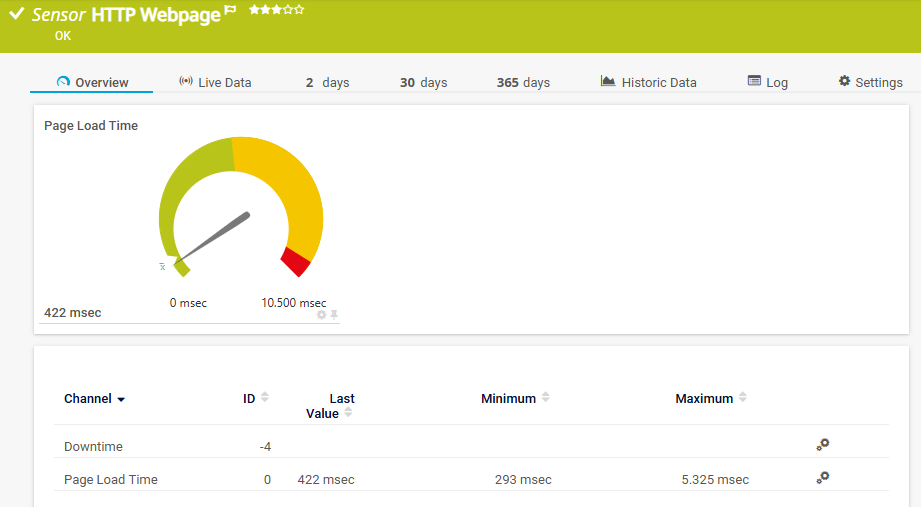
 For a detailed list and descriptions of the channels that this sensor can show, see section
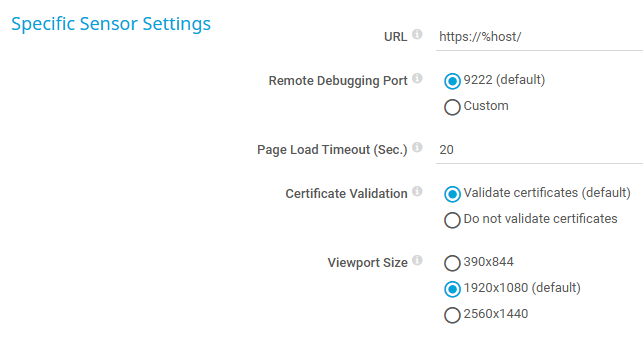




 This option is not available when the sensor runs on the hosted probe of a PRTG Hosted Monitor instance.
 under the corresponding setting name to disable the inheritance and to display its options.